Best Technical Indicators for Swing Trading in Stock Market
This blog will explain the most commonly used indicators in swing trading. Where traders can make the right decisions and manage their risk in the Indian markets.
Let advisor assist you
Explanation of Swing Trading?
Swing trading is one of the popular short-term strategies where the traders focus on identifying swing prices over a few days or weeks. Whoever is active in the Indian stock market, where technical analysis plays an important role in finding the right entry and exit points.
This trading usually involves holding positions for days or weeks, not more than that. Unlike intraday trading, swing traders are not focused on market fluctuations every minute. Instead, these traders find the segment using different charts, patterns, and technical indicators for swing trading. So, using the best technical indicators for swing trading in stock market is very much useful for all the traders.
Use of Technical Indicators for Swing Trading?
In the Indian stock markets, depending on price action will not be sufficient to enter and exit. So, using technical indicators will help to filter trends and momentum. They act as supportive tools to understand about oversold or potential traders in the market.
1. Moving Averages (MA) Indicator
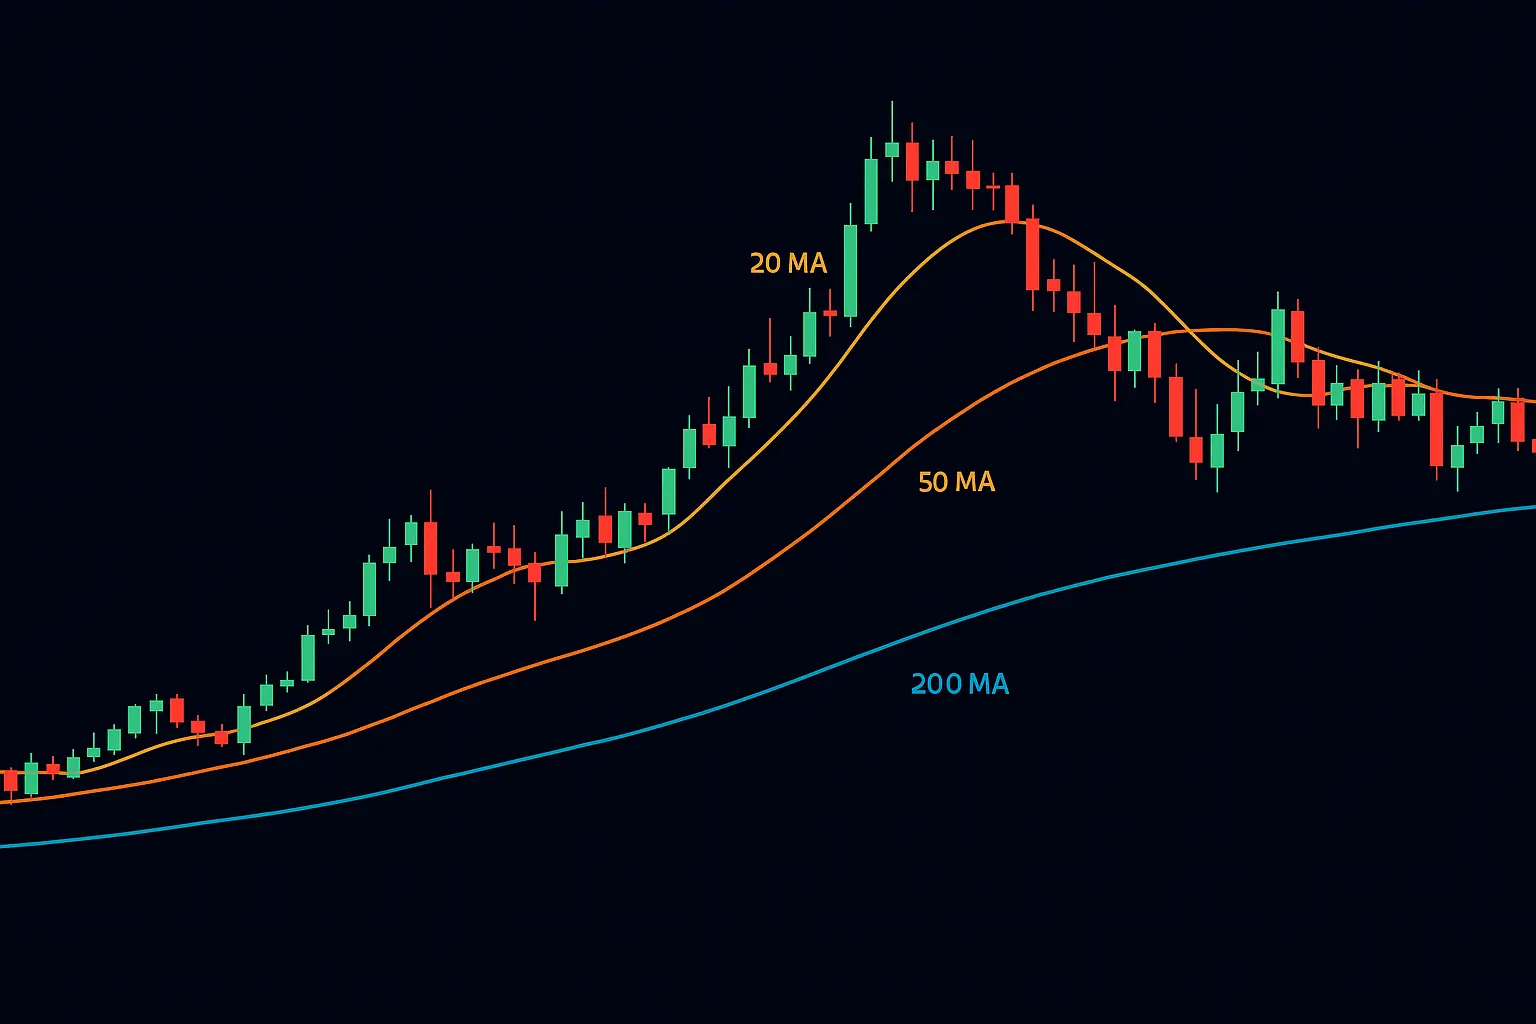
This indicator helps to spot the direction of the trend. The most used types are:
Simple Moving Average
Exponential Moving Average
In swing trading exponential moving average is commonly used. If the price is above the lines, this will indicate the upward momentum.
2. Relative Strength Index Indicator
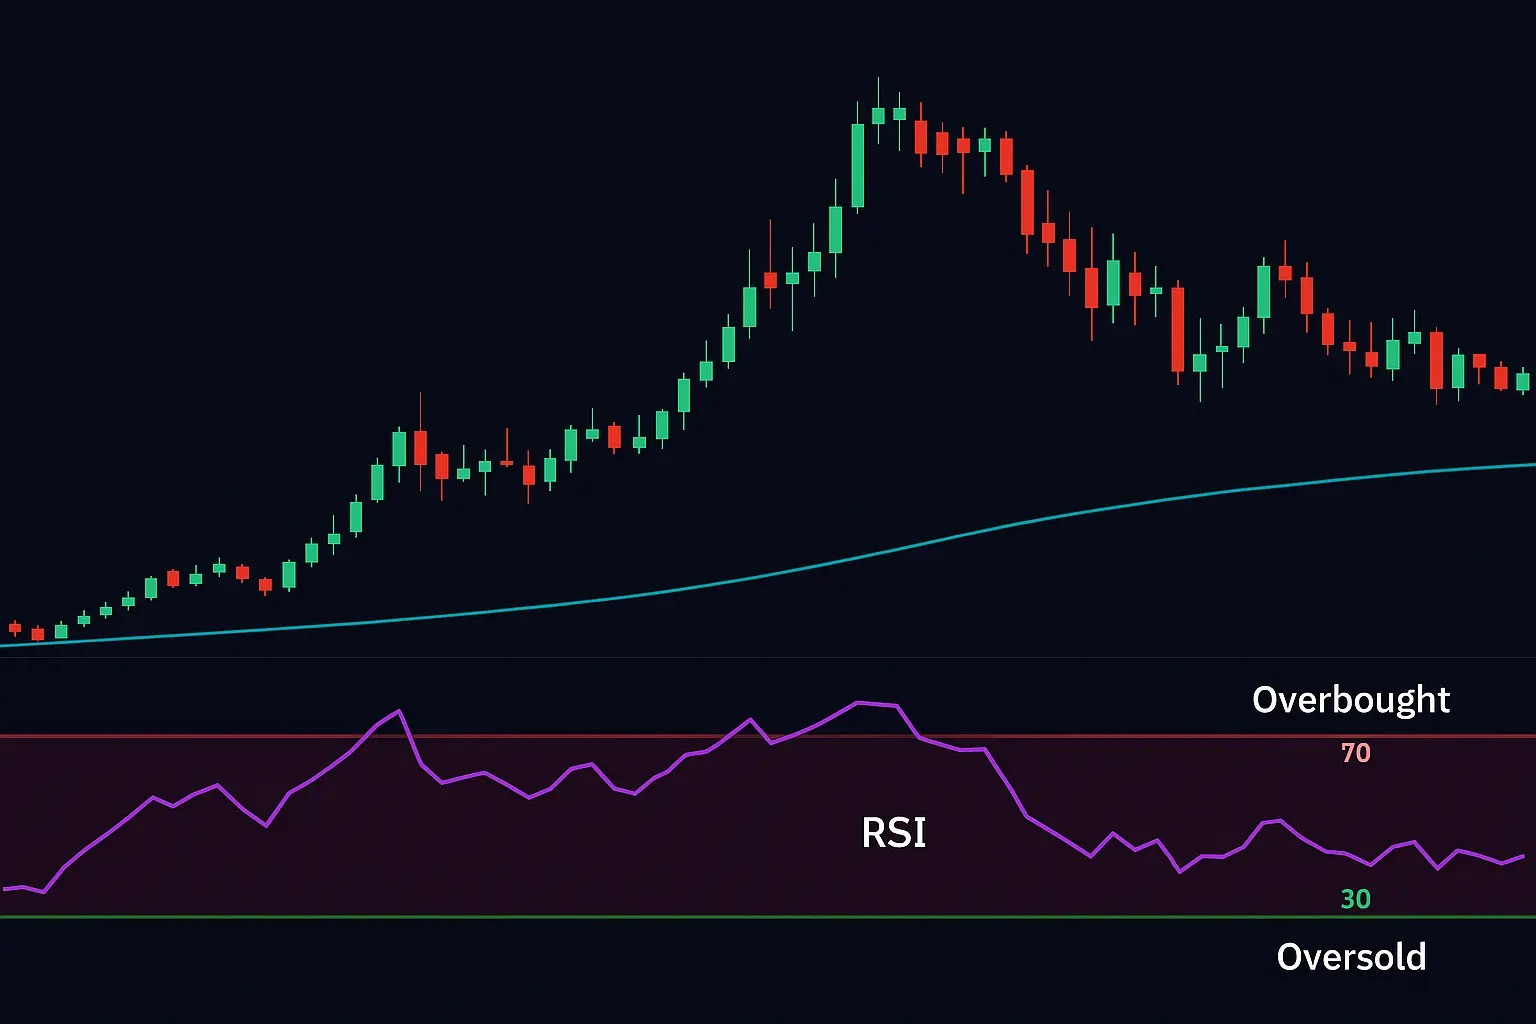
This ranges between 0 and 100. The RSI indicator measures the speed and price movement change.
If RSI values are above 70, this indicates overbought conditions.
If RSI values are below 30, this indicates oversold conditions.
Swing traders use the RSI indicator to find potential reversal zones. This is useful in identifying short-term prices in Indian stocks.
3. MACD Indicator
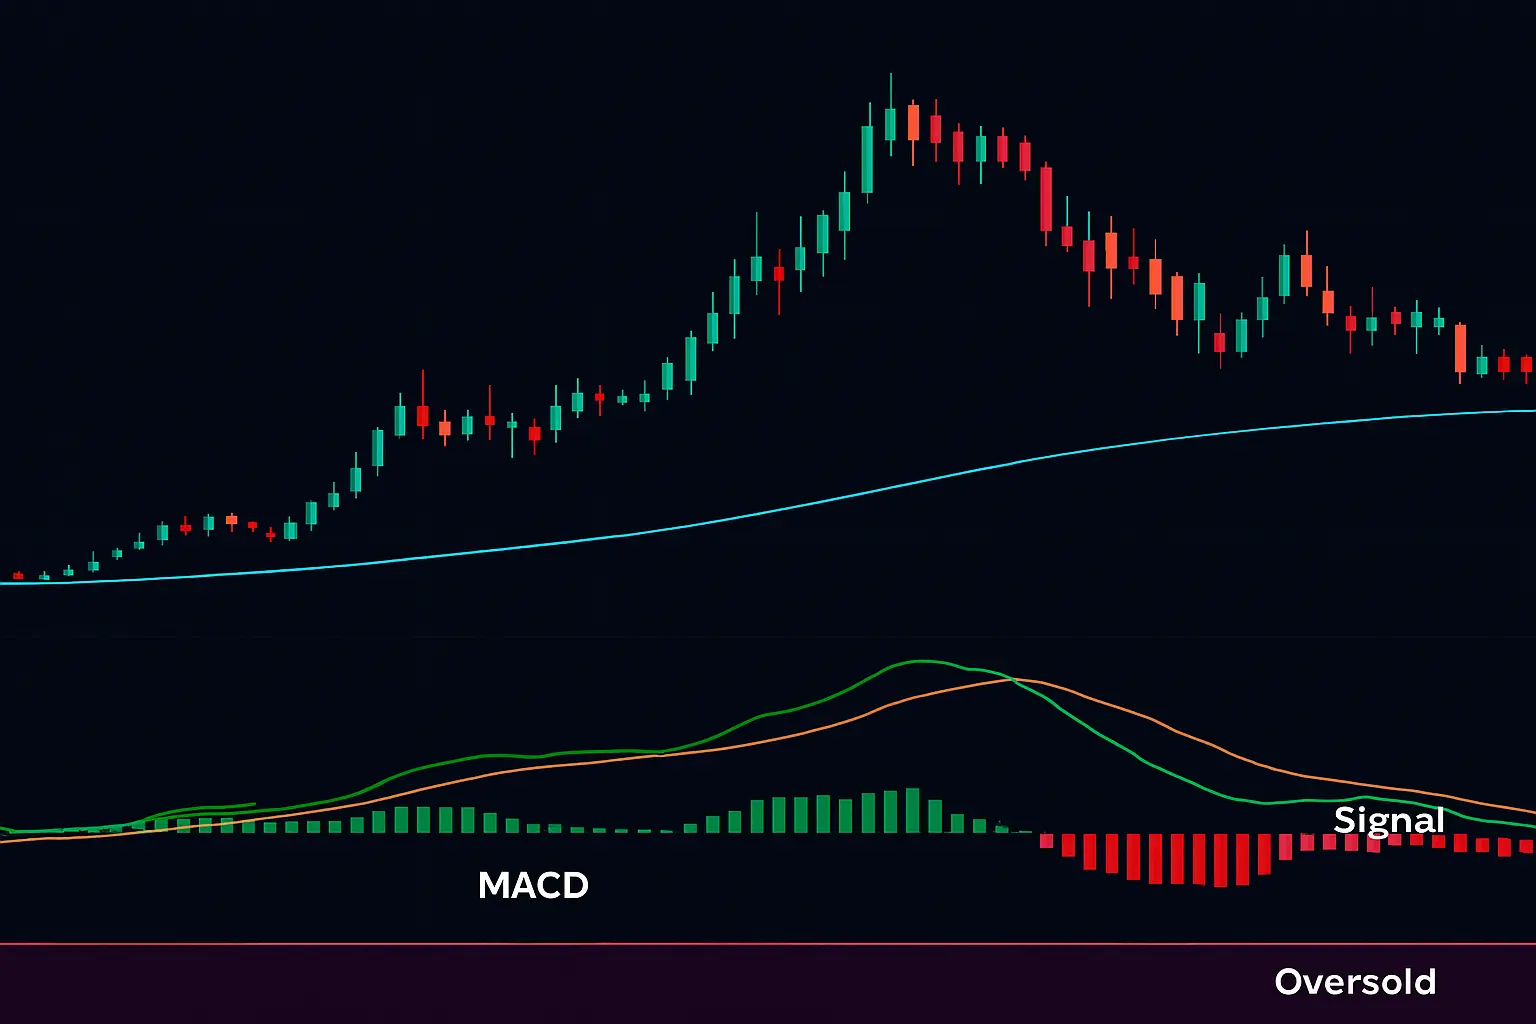
The MACD indicator shows the relationship between two exponential moving averages. It provides buy/sell signals when:
If the MACD line crosses above the signal line, it indicates a bullish signal.
If the MACD line crosses below the signal line, it indicates a bearish signal.
MACD is the most important technical indicator in swing trading. Especially to identify the trends.
4. Bollinger Bands Indicator
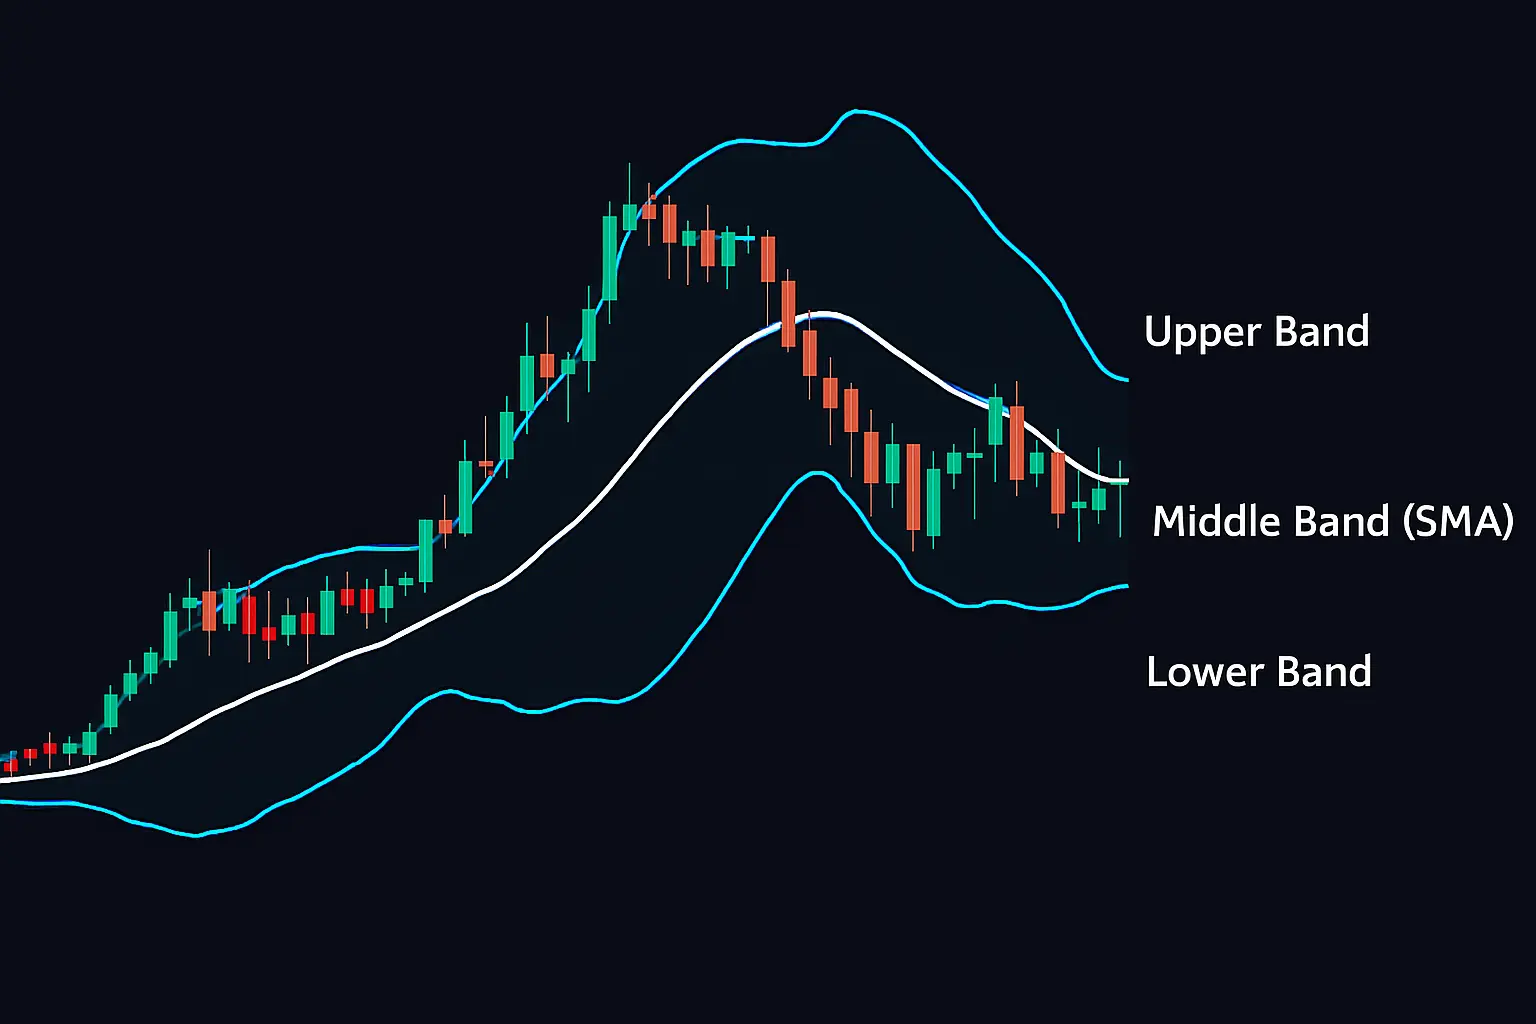
This indicator consists of three lines: simple moving averages and two standard deviations above and below. These will help to identify volatility and potential breakout zones.
It shows high volatility when the brands are widened.
It suggests a potential breakout when the bands are contracted.
Traders use this indicator to find overbought or oversold trade levels accordingly.
5. Stochastic Oscillator Indicator
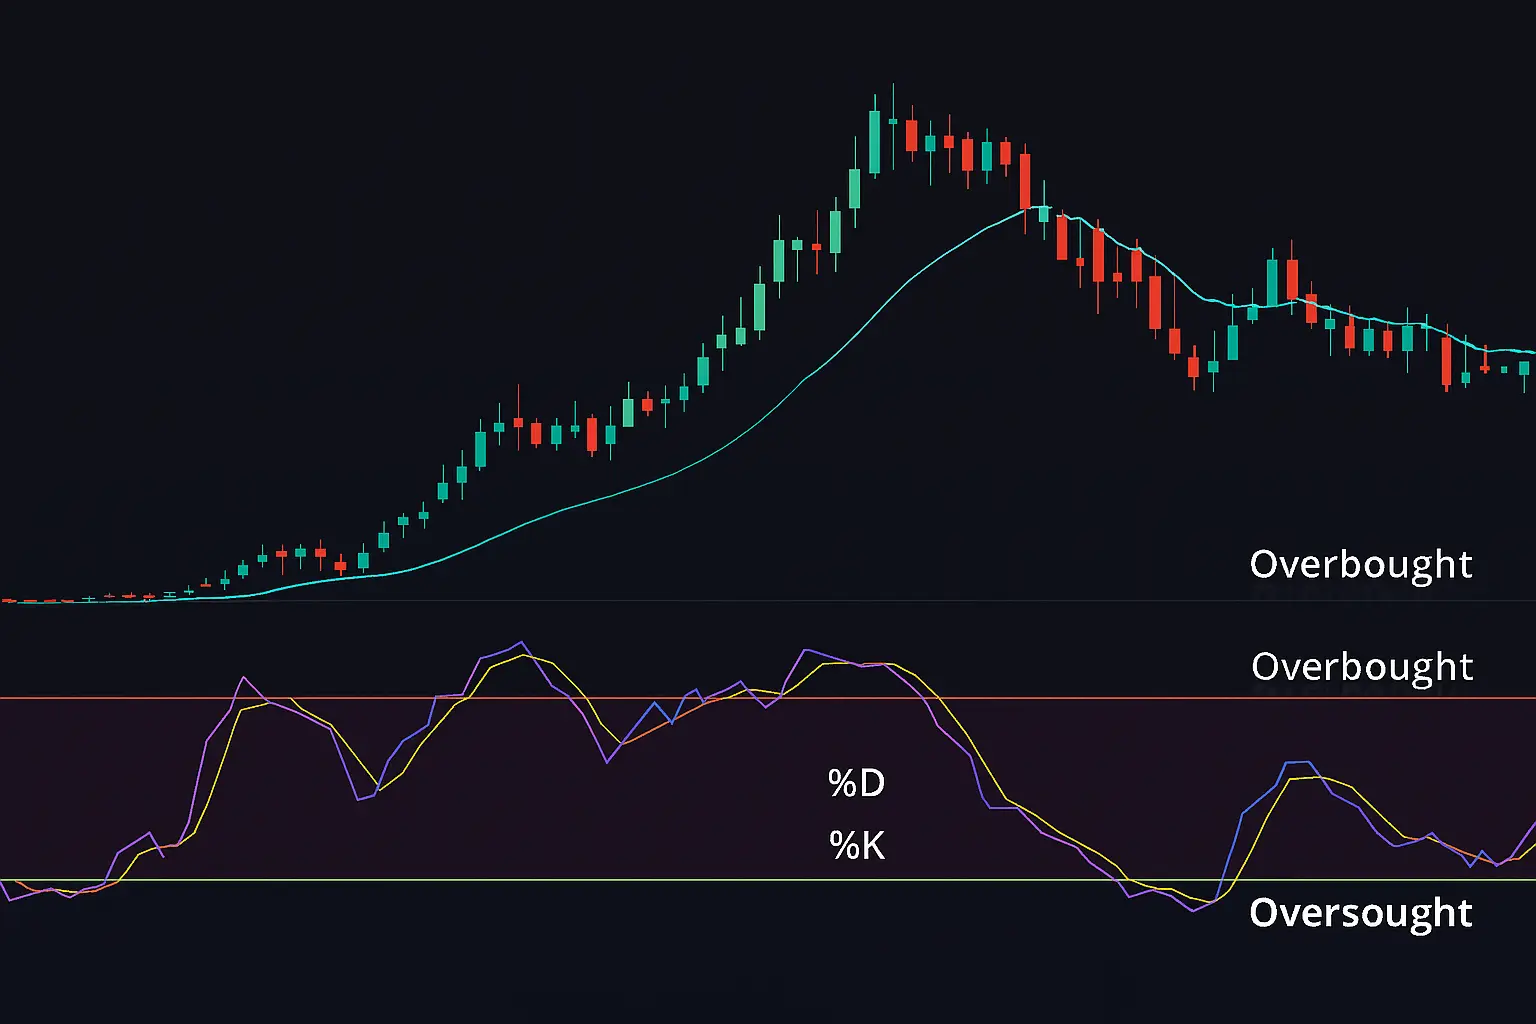
This indicator compares a stock’s closing price, and also it helps to identify oversold and overbought conditions.
If the %K line crosses above the %D line, it can indicate a potential buy.
If the %K line crosses below the %D line, it may signal a potential sell.
This indicator is often used in daily charts to evaluate short-term reversals.
6. Using Volume Analysis
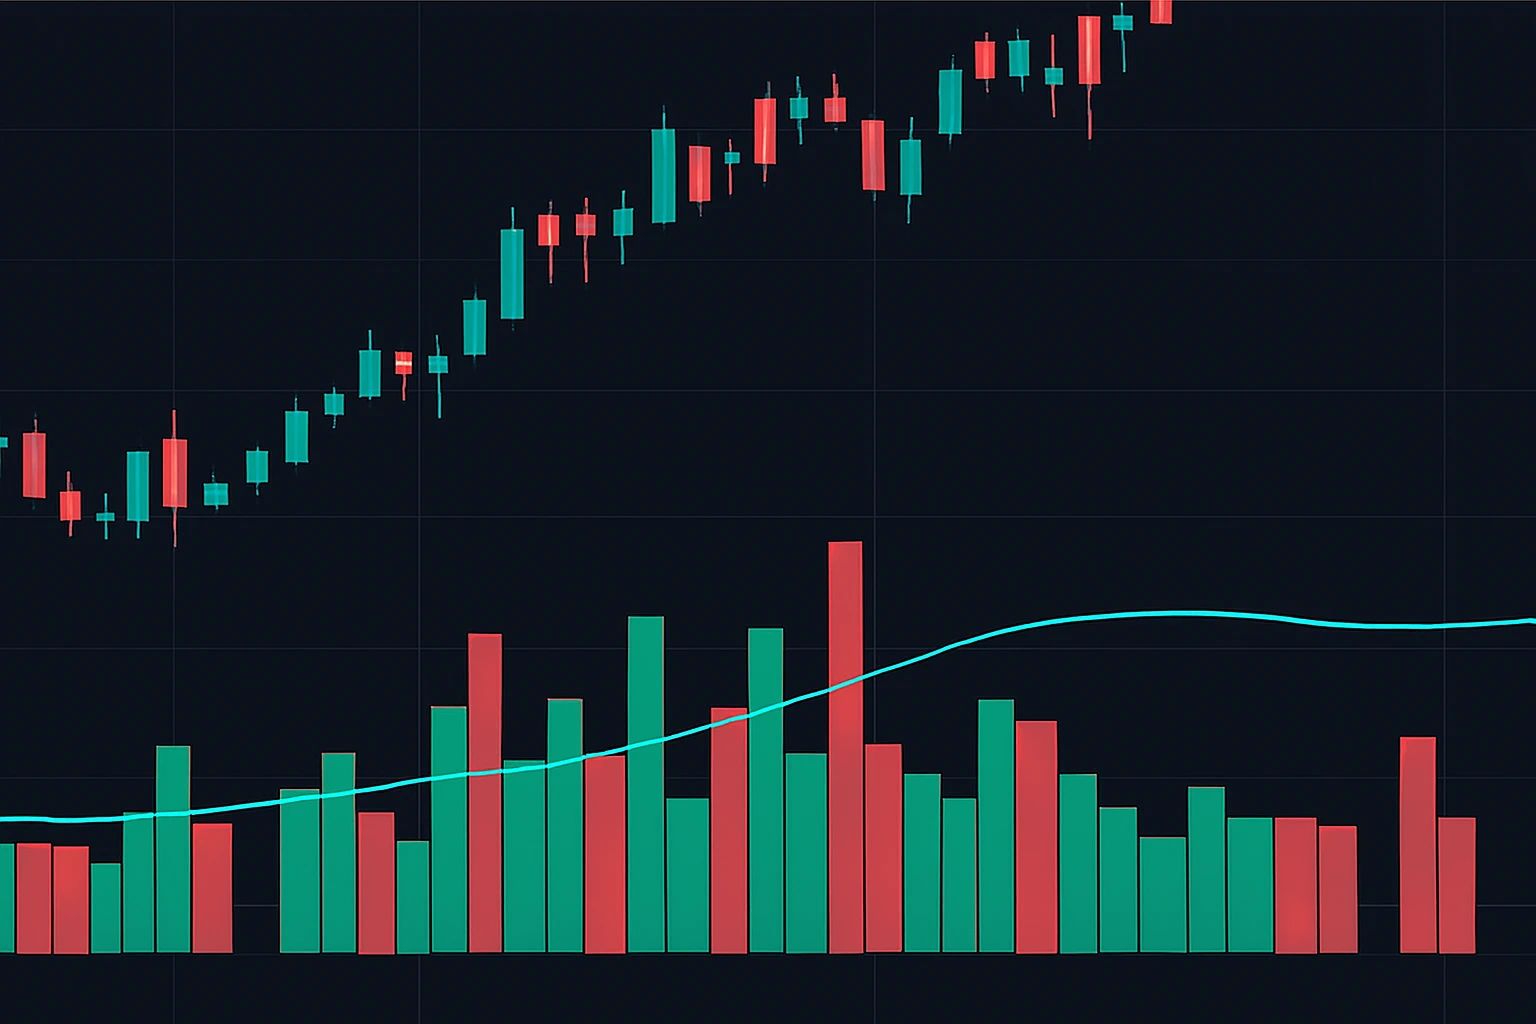
Volume analysis plays a major role in confirming price movements. Raising volume supported by uptrends is considered more sustainable when compared to low volume.
Swing traders analyze spikes in the volume during the breakouts or breakdowns to validate the strengths. This is one of the best technical indicators for swing trading in stock market.
7. Using Average True Range
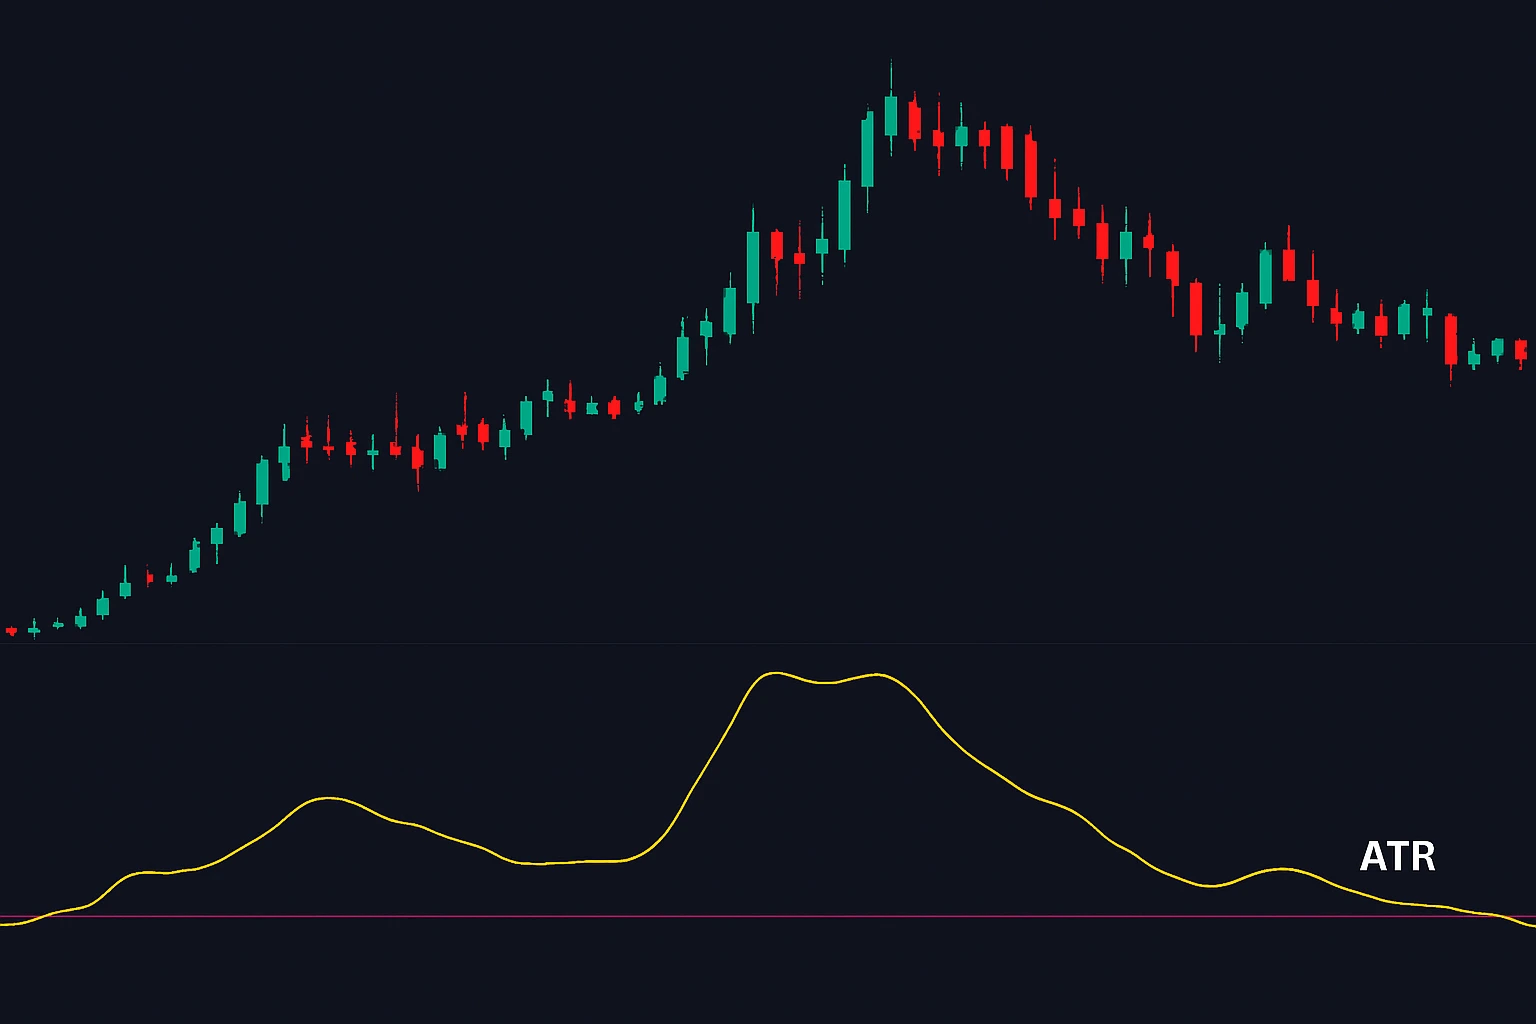
The average true range indicator helps to measure market volatility. This will not show the direction, but this will help to determine the stop-loss.
If the ATR is high, this will indicate high volatility; a low ATR indicates a stable market. And this will not show the direction, but this is used for risk management in swing trading setups.
8. Use of Fibonacci Retracement
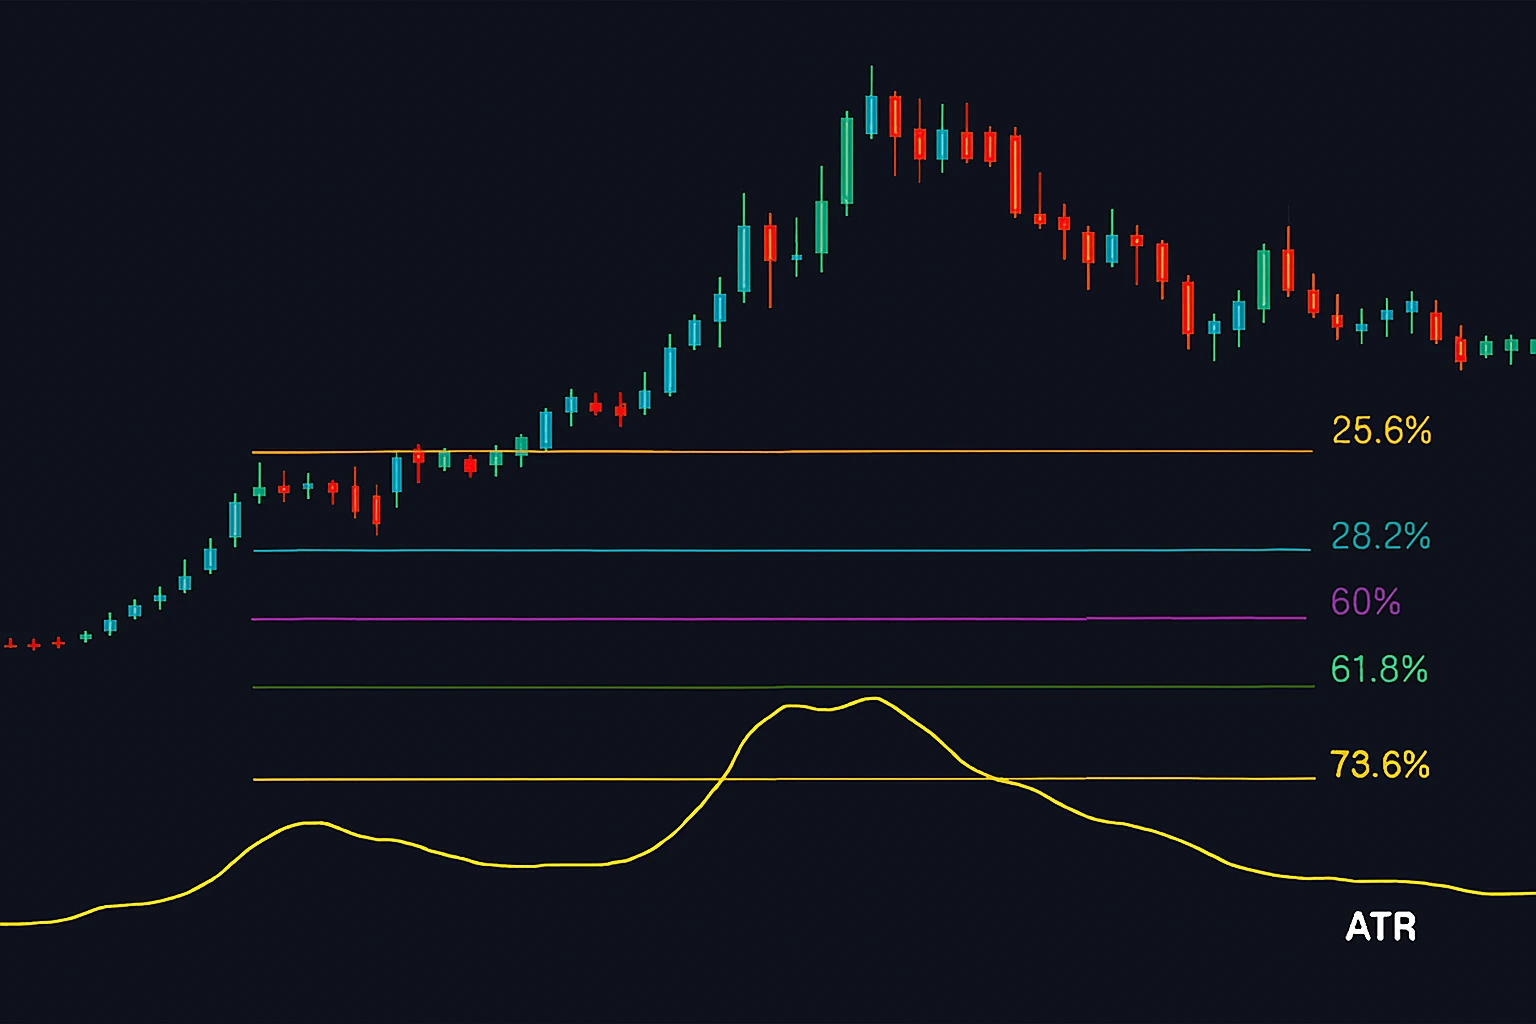
These Fibonacci levels are calculated based on the key ratios: 23.6%, 38.2%, 50%, 61.8%, and 78.6%.
By using these levels, traders will identify the possible support and resistance zones. By combining this with technical indicators for swing traders, it will improve decision-making. It is one of the best technical indicators for swing trading in the stock market.
9. Supertrend Indicator
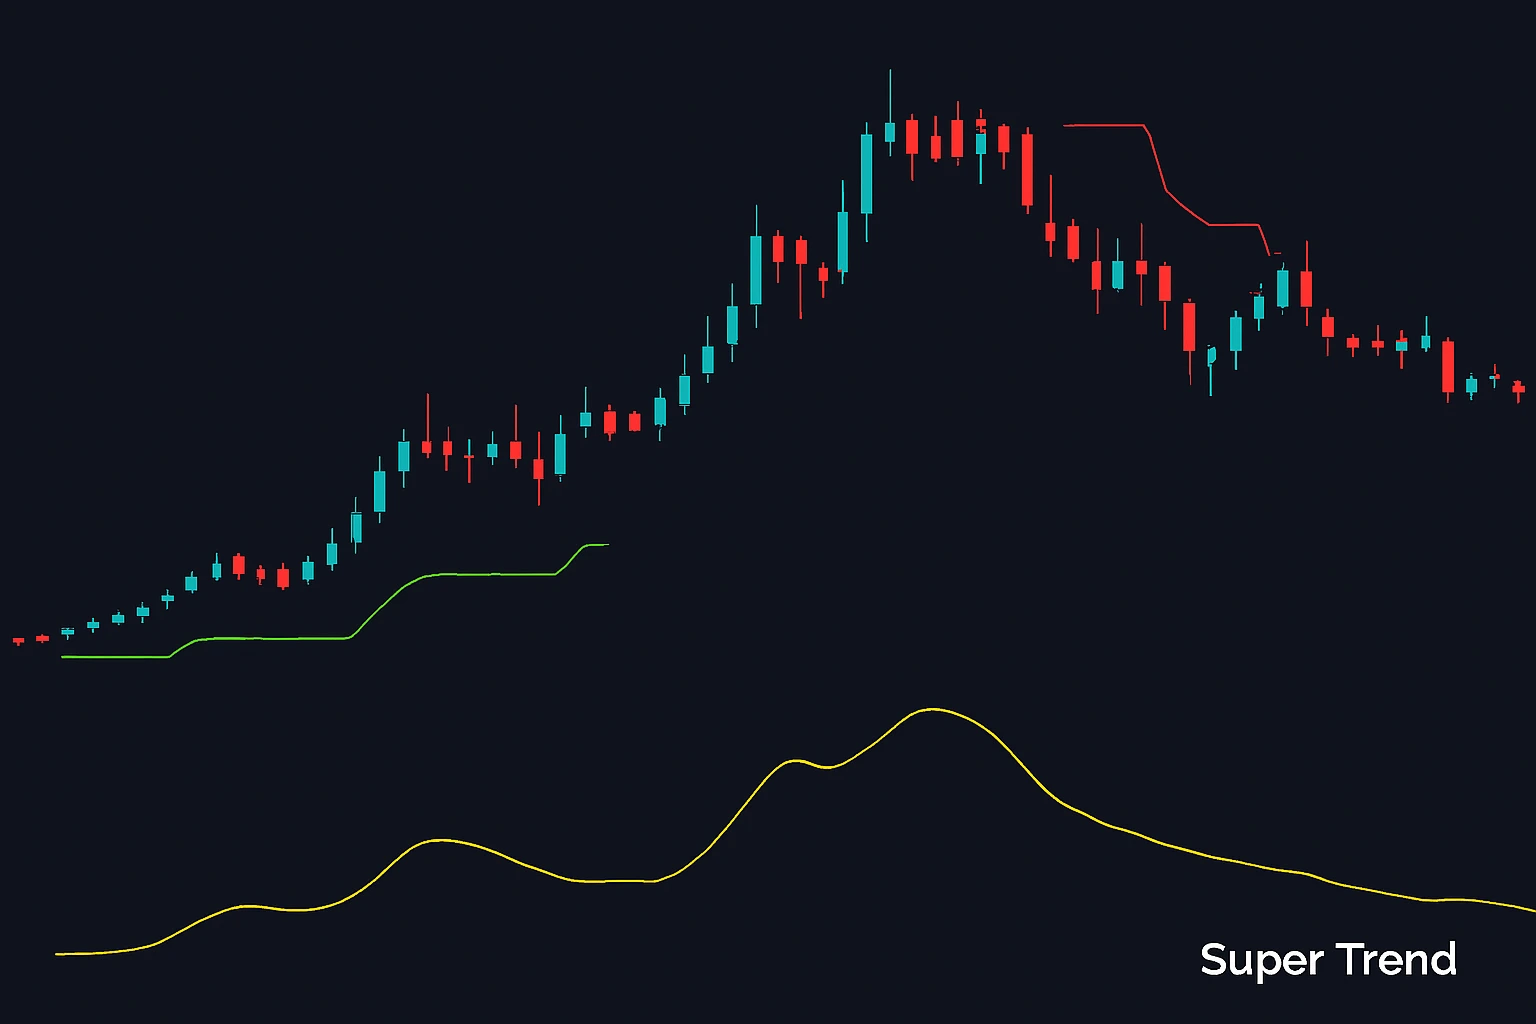
This indicator is not known by many people, but this indicator follows the price trends and entry and exit points using price and volatility.
A buy signal is set off when the price closes above the indicator line
A sell signal is set off when the price closes below the line
This is user-friendly and commonly used with Nifty and Bank Nifty by swing traders.
10. Parabolic SAR
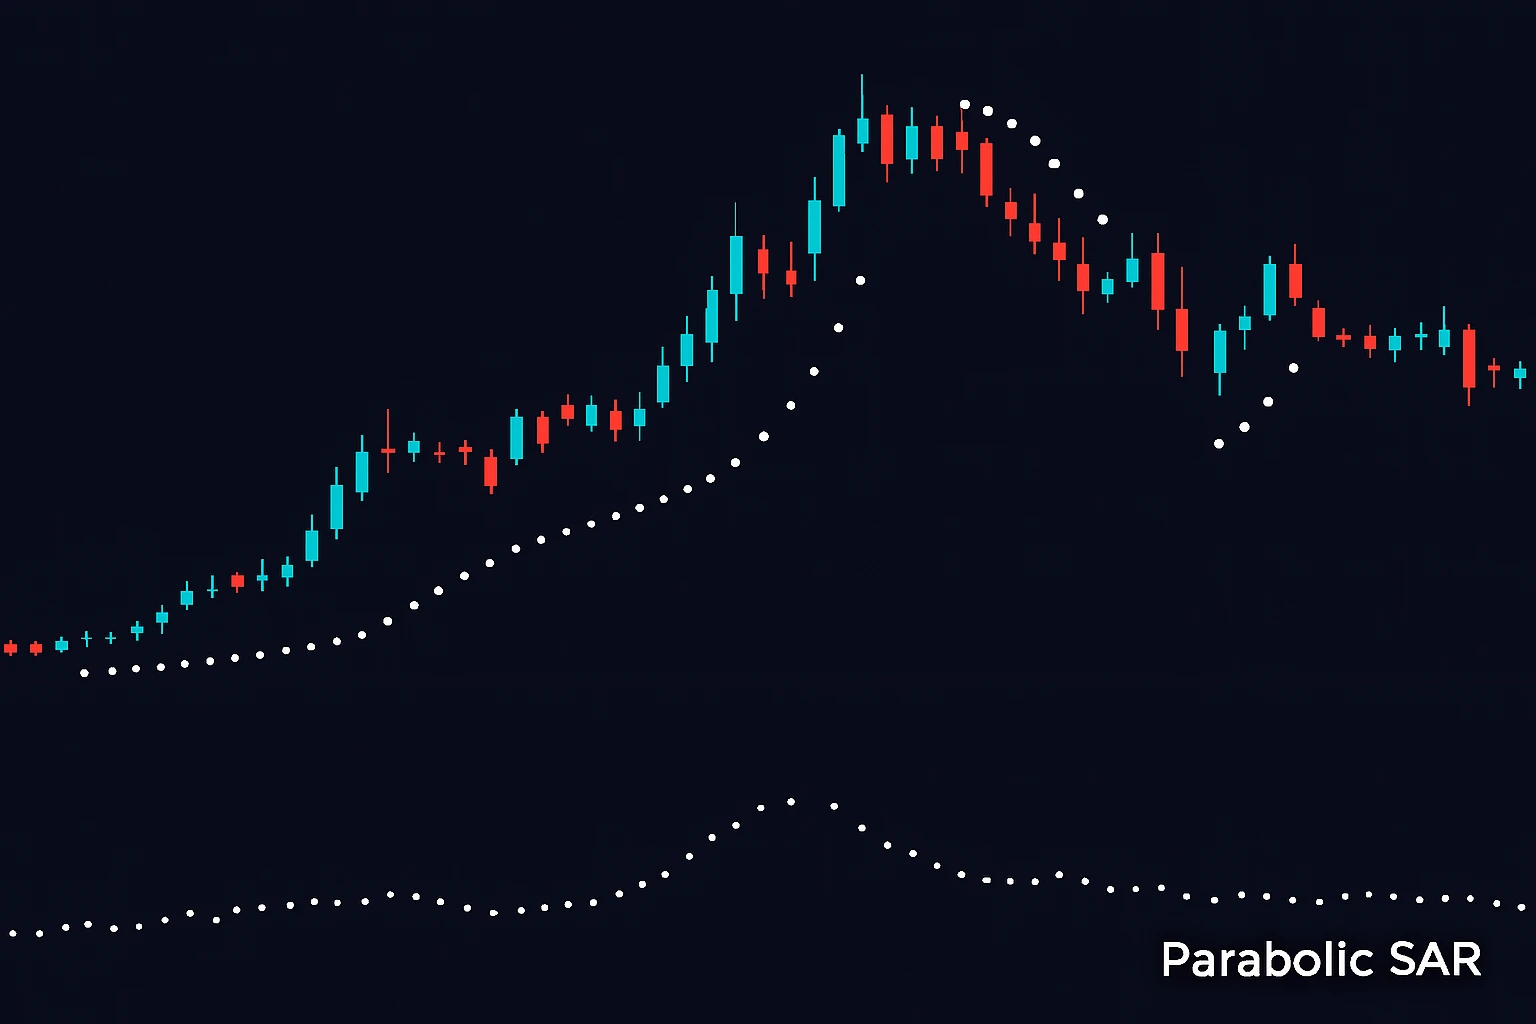
The parabolic SAR indicator is used for stop-losses and to confirm trend direction.
If the dots below the price suggest an uptrend
If the dots above the price suggest a downtrend
This works in trending markets and other trend-following tools.
How to Use These Indicators Effectively?
While all these indicators work effectively. Using them may not give accurate results. The most effective way to use technical indicators for swing trading is through a combination strategy. For instance:
- By combining RSI with Bollinger Bands to identify overbought zones.
- Using MACD and moving averages together to confirm trend shifts.
- Use volume and ATR to confirm the strength and volatility of the trend.
Swing trading tips for Indian Markets
Before placing the trade, always define proper entry and exits. Try to avoid depending on a single indicator. Also set proper stop-loss based on volatility and trends. Regularly review mid- and large-cap stocks that have good liquidity.
Visit swing trading tips, click on the below button
Conclusion
Using the right indicators in swing trading can improve market analysis and trading decisions in a disciplined manner. Especially these tools in the Indian stock market, where volatility and sector rotation will offer several short-term and mid-term opportunities.
Traders always focus on your strategy before applying with real capital. A balanced approach will combine technical tools, and risk management will help in the success of swing trading.
